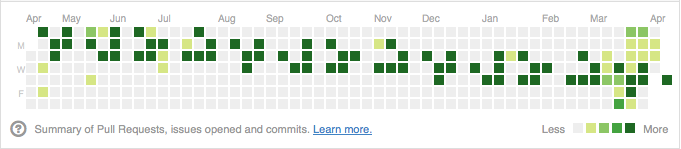
GitHub profile pages include a neat visualization of commit history that they call the "contributions calendar". This 53x7 grid shows the number of commits and other GitHub interactions that the user performed on each day for the last year.
Each cell in the graph is shaded with one of 5 possible colors. These colors
correspond to the quartiles of the normal distribution over the range
[0, max(v)] where v is the sum of issues opened, pull requests proposed and commits authored per day.
If your all time high for the last year was 100 contributions in a single day, the cells would color like this:
| Contributions | Color |
|---|---|
| 0 |  |
| 1 - 24 |  |
| 25 - 49 |  |
| 50 - 74 |  |
| 75+ |  |
A tweet got me interested in the possibility of gaming the interaction data to control the display:
GitHub users might find this guy's contribution graph interesting/funny: github.com/will
— Peter Cooper (@peterc) April 12, 2013
@will has done something to make his calendar spell "WILL" over and over. Looking at his contribution activity list it was pretty obvious that this trick had something to do with the will/githubprofilecheat and/or will/githubprofilecheat2 repositories.
I did some digging in the git documentation to see how hard it is to fake
the date on a commit. It turns out that it's as easy as setting an environment
variable. The GIT_AUTHOR_DATE and GIT_COMMITTER_DATE environment variables
can be used to provide git-commit-tree with dates for the author and
commit dates that are attached to each commit object.
Armed with this bit of trivia I decided that I would try to do something interesting with my contributions graph. I didn't just want to copy @will and write my name in the graph. I decided that I would pay homage to my gravatar instead and make a series of gliders that ran across the timeline. The result of my experiment can be seen in the image at the top of this post.
The script that I used to generate the commits with faked dates is available in my bd808/profile-life repository.
The script takes the path to a pattern file and an optional start date as arguments.
./bin/pattern-to-commits.sh patterns/glider.cells 2012-04-15 | sh
The pattern file is expected to be in the plaintext Life format. This format allows you to specify an on/off pattern. When a cell is "on" the script will output 23 commits (one per hour) for the corresponding day. "Off" cells won't generate any commit activity.
!Name: Profile Glider Train
!A simulation of a glider cruising across the contributions timeline.
O.O...O.O....O..................................................................
.OO.O.O..OO...O.O.O...O.O....O..................................................
.O...OO.OO..OOO..OO.O.O..OO...O.O.O...O.O....O..................................
.................O...OO.OO..OOO..OO.O.O..OO...O.O.O...O.O....O..................
.................................O...OO.OO..OOO..OO.O.O..OO...O.O.O...O.O....O..
.................................................O...OO.OO..OOO..OO.O.O..OO...O.
.................................................................O...OO.OO..OOO.
The script reads in this file a column at a time using the cut command. It
loops over the characters from the column and when it finds an O it echos
commit commands to stdout:
GIT_AUTHOR_DATE='2013-04-17T20:00' GIT_COMMITTER_DATE='2013-04-17T20:00' \
git commit --allow-empty -m '2013-04-17T20:00'
This output can be piped to bash to apply the commits to the repository.
An interesting extension of this script would be to support all 5 possible colors. It would also be nice if the script read your current contribution history to determine how many commits are necessary to hit the 4th quartile every time. For now these additions are left as an exercise for the reader. :)
Comments